Share Amazon performance clearly
Give founders and channel leads a concise view of Amazon sales, advertising, stock and the decisions waiting for them.
Know where the sales are coming from, where costs are creeping up, and what needs attention. We turn scattered account data into reporting you can use to make your next move.
This Amazon Ads screenshot shows campaign results for a defined period. Reporting 2.0 connects source data with sales, product costs, and account conditions before recommending an action.
See the PPC management page ↗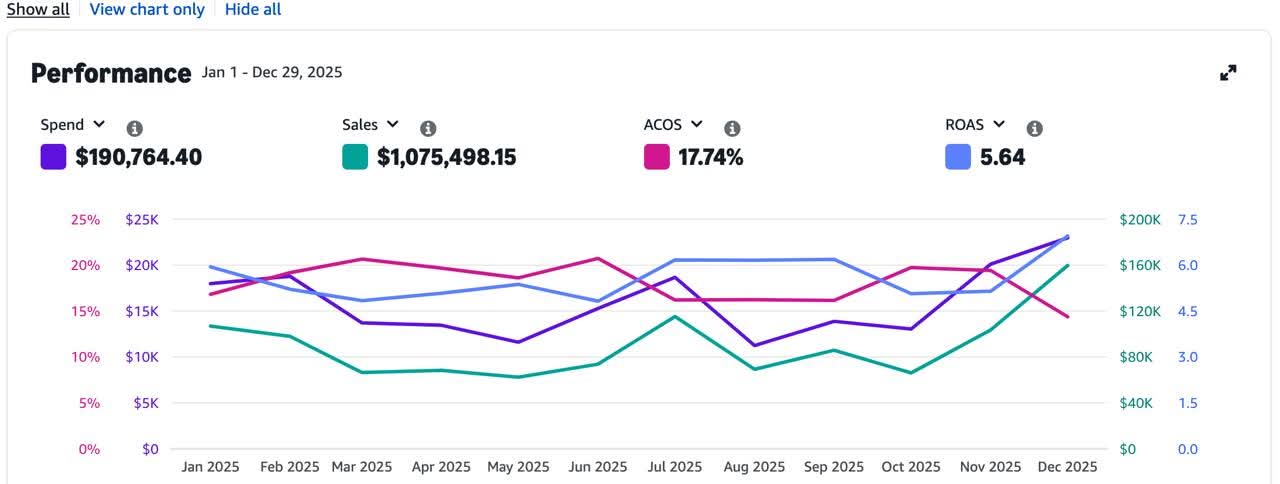
Keep the detail your specialists need and explain the decisions it supports for the wider team.
Give founders and channel leads a concise view of Amazon sales, advertising, stock and the decisions waiting for them.
Review sales, advertising, conversion, and inventory together, using consistent definitions rather than isolated dashboard totals.
Connect what changed to its likely causes before shifting budget or changing the Amazon growth plan.
Choose measures that answer your team’s questions, with clear definitions and an explanation of missing inputs.
Review sales, conversion, and ad changes at product and campaign level, alongside stock, pricing, and the other account conditions that may explain them.
Start with the meaningful Amazon or ecommerce shift, not a wall of metrics.
Look across Amazon sales, traffic, conversion, advertising efficiency and availability. Separate normal variation from a signal worth investigating.
Read the shift at ASIN, SKU and campaign level. Did demand change, the offer weaken, stock tighten, or spend move to a different product?
Turn the ecommerce findings into a ranked action, a responsible owner and a point to review whether the change worked.
Your reporting scope follows the decisions you need to make and the data available from your Amazon account and business records.
Review revenue, units, product mix, and available cost inputs without presenting sales growth as profit growth.
Track spend, attributed sales, search terms, and relevant efficiency measures alongside total account sales.
Review sessions, order conversion, offer availability, and listing changes to understand how visits become purchases.
Inventory availability, suppressed listings and other Amazon account conditions that can interrupt an otherwise good plan.
Founders may need a concise sales and priority view; channel teams need ASIN and campaign detail. Finance needs defined cost inputs. Reports should make those perspectives comparable without hiding limitations.

Monitor inventory, advertising spend, listing health and other Amazon changes that may need prompt action.
Compare recent Amazon sales and advertising trends with the work completed, then agree on the next focused actions.
Step back to product economics, marketplace priorities and the next ecommerce investment decision.
These AMZEXACT case studies show different Amazon sales, advertising and conversion views. Each report source, metric definition and time period should be read on its own terms.

The study separates its sales comparison from the paid-media reporting period.
Read the case study ↗
A dated Seller Central snapshot and a separate ad view give context to a margin-sensitive category.
Read the case study ↗
Product education and advertising are considered together rather than as isolated work.
Read the case study ↗These client stories discuss Amazon account management, advertising and marketplace growth—the work that gives reporting its commercial context.
Great Amazon UK account management. Professional, reliable, and very knowledgeable. Communication was excellent and the account was managed smoothly.

The service can include sales, PPC, inventory, and contribution reporting, with metric definitions agreed during onboarding. Reports explain material changes, missing information, and the actions those findings support.
We agree on account permissions and report sources, then identify the cost and operations inputs needed from your team. Missing product costs, freight, or returns information is flagged—not assumed to be zero.
They can support contribution or profit estimates when cost records are complete and definitions are consistent. Revenue and ad-attributed sales alone do not establish profit; the report explains the calculation and its limitations.
The proposal defines report delivery, reviews, and any exception alerts. Frequency follows your operating decisions and scope rather than an implied real-time or round-the-clock service.
Reports may use different attribution windows, order or shipment dates, time zones, currencies and adjustment rules. We reconcile definitions before interpreting a difference as a performance problem.
Your business retains its account data. Report formats, access, exports and the handover process should be specified in the engagement scope.
Tell us which sales, advertising, or inventory questions your current reports leave unanswered.
Request a free Amazon audit ↗AI answers may be imperfect. Do not share passwords, account data, or private customer information.